- Student NIKHIL SRIVASTAVA
- Code PGE22222
- Faculty Technology
- Tutor/s Shaily Gandhi,Manushi Bhatt,Sweta Rajpurohit
- TA Kirtan Shah
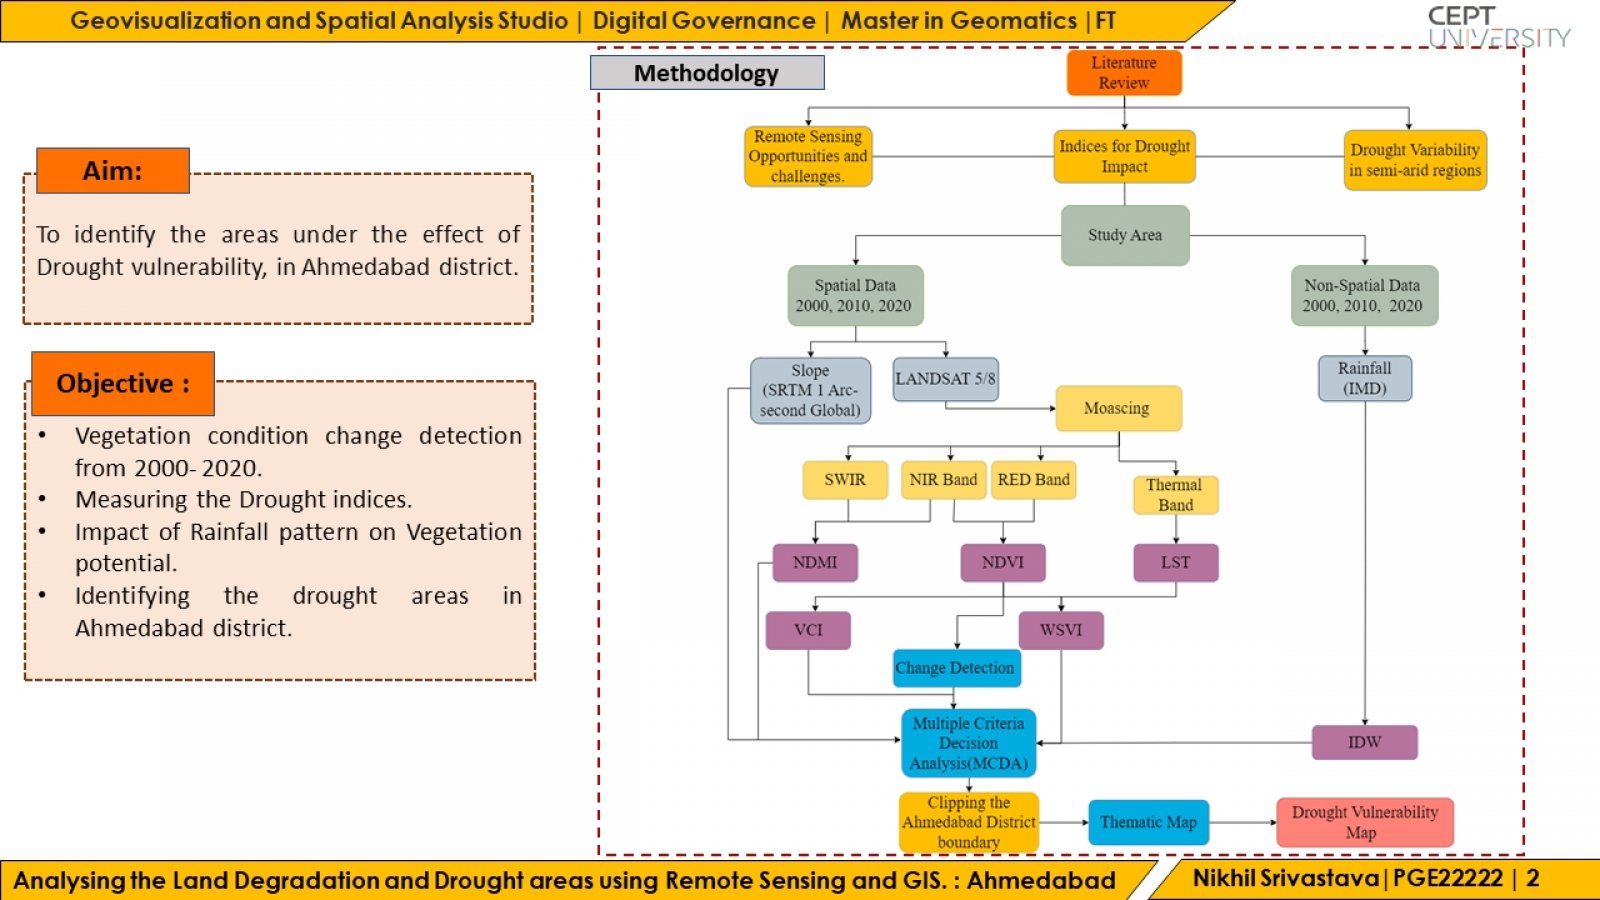
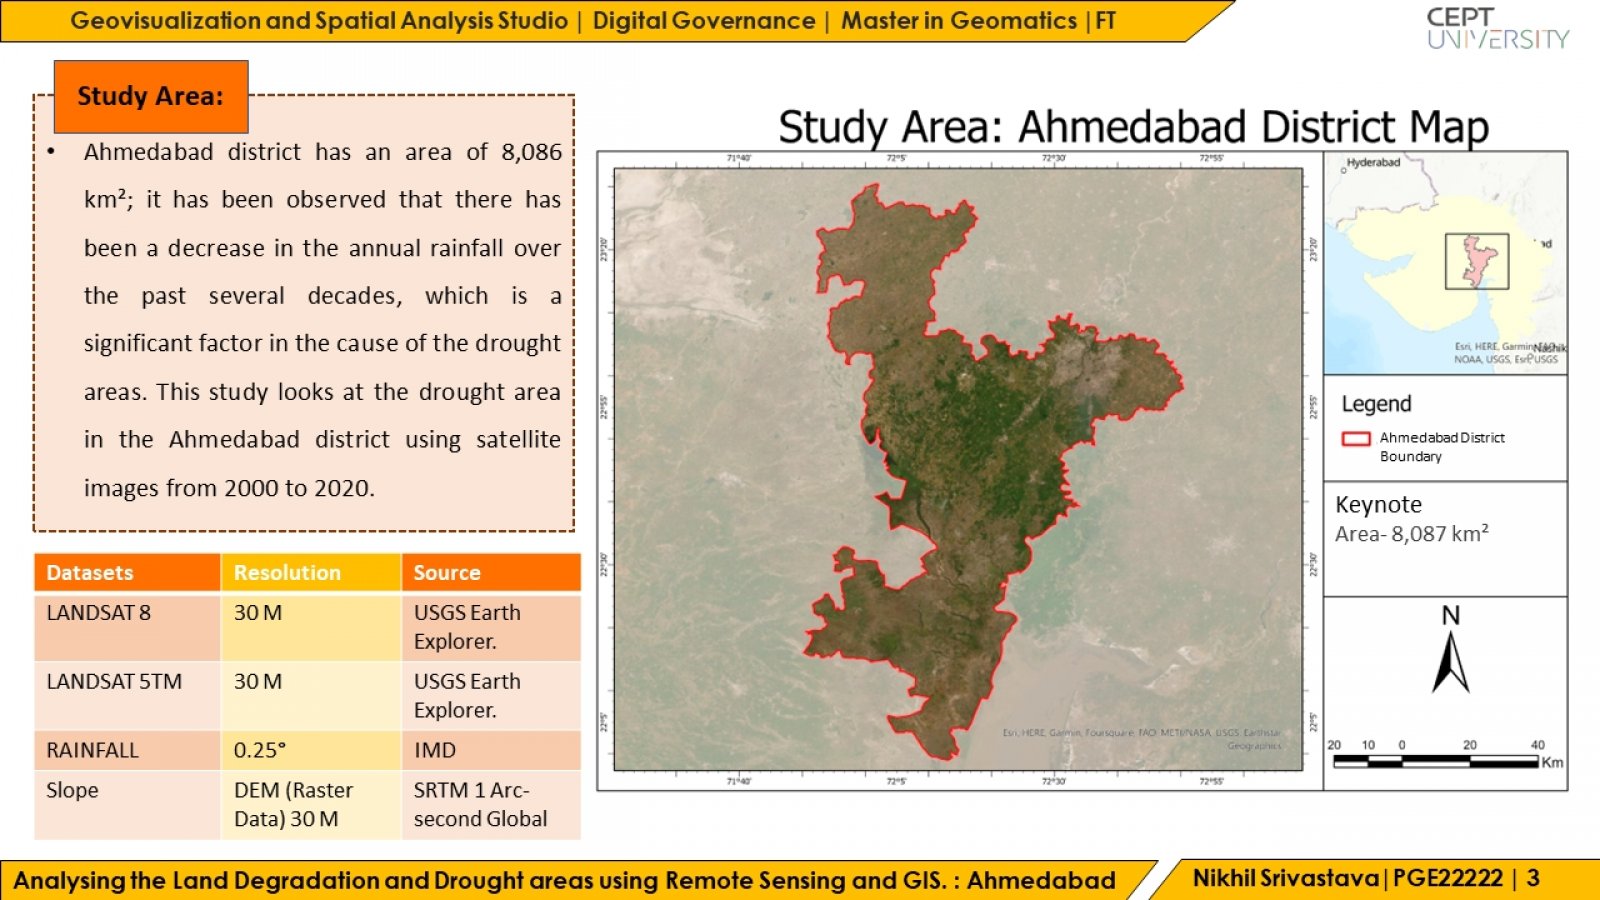
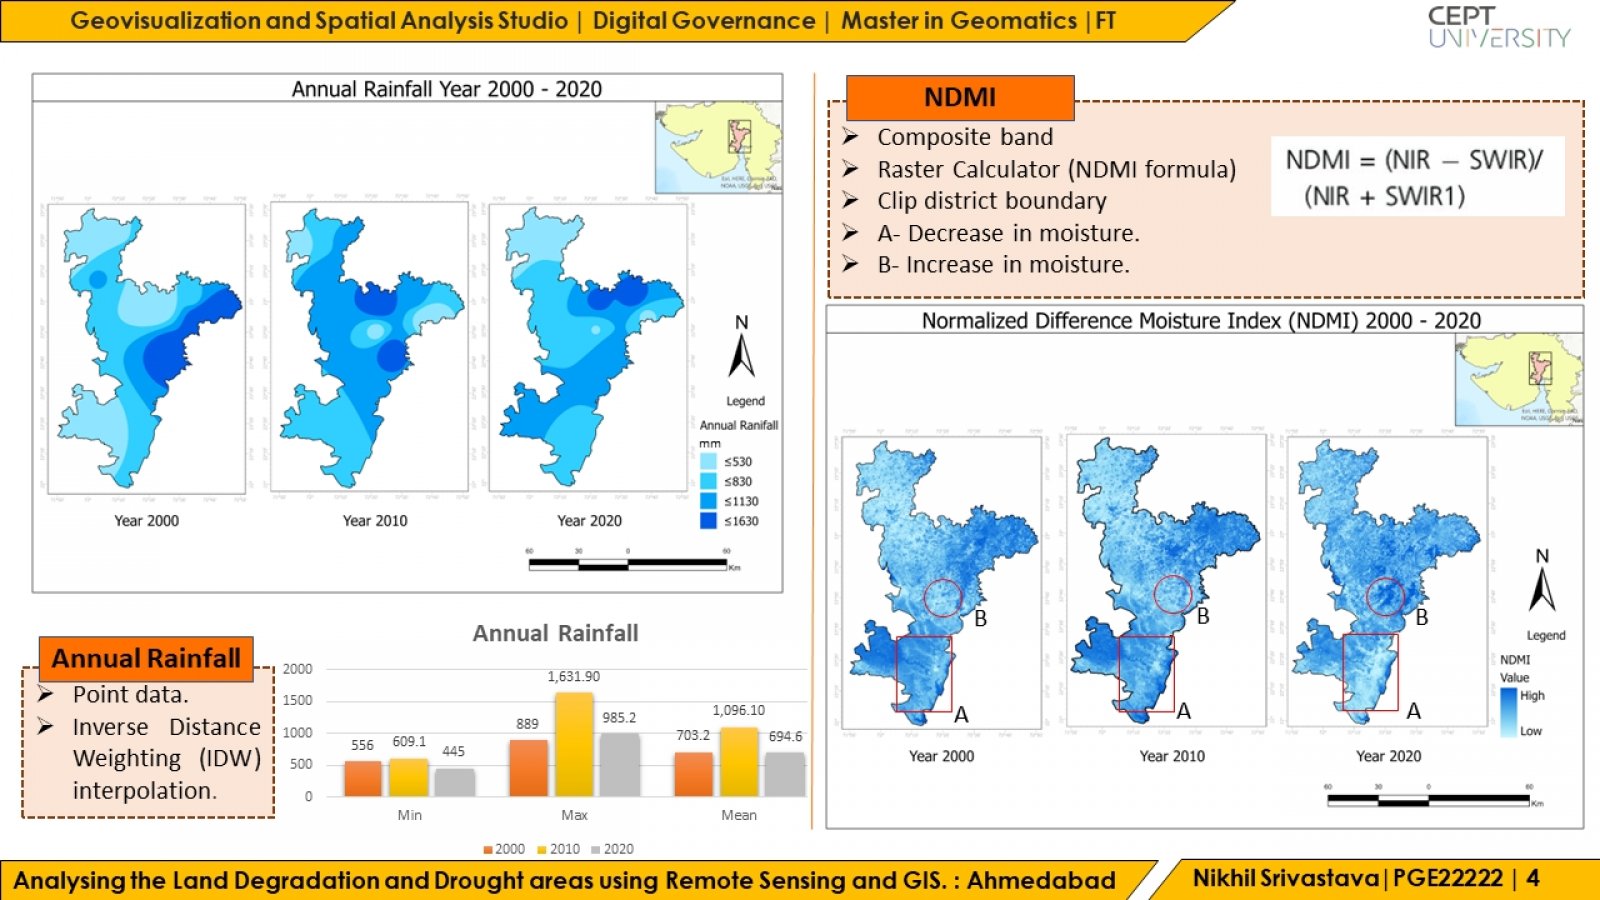
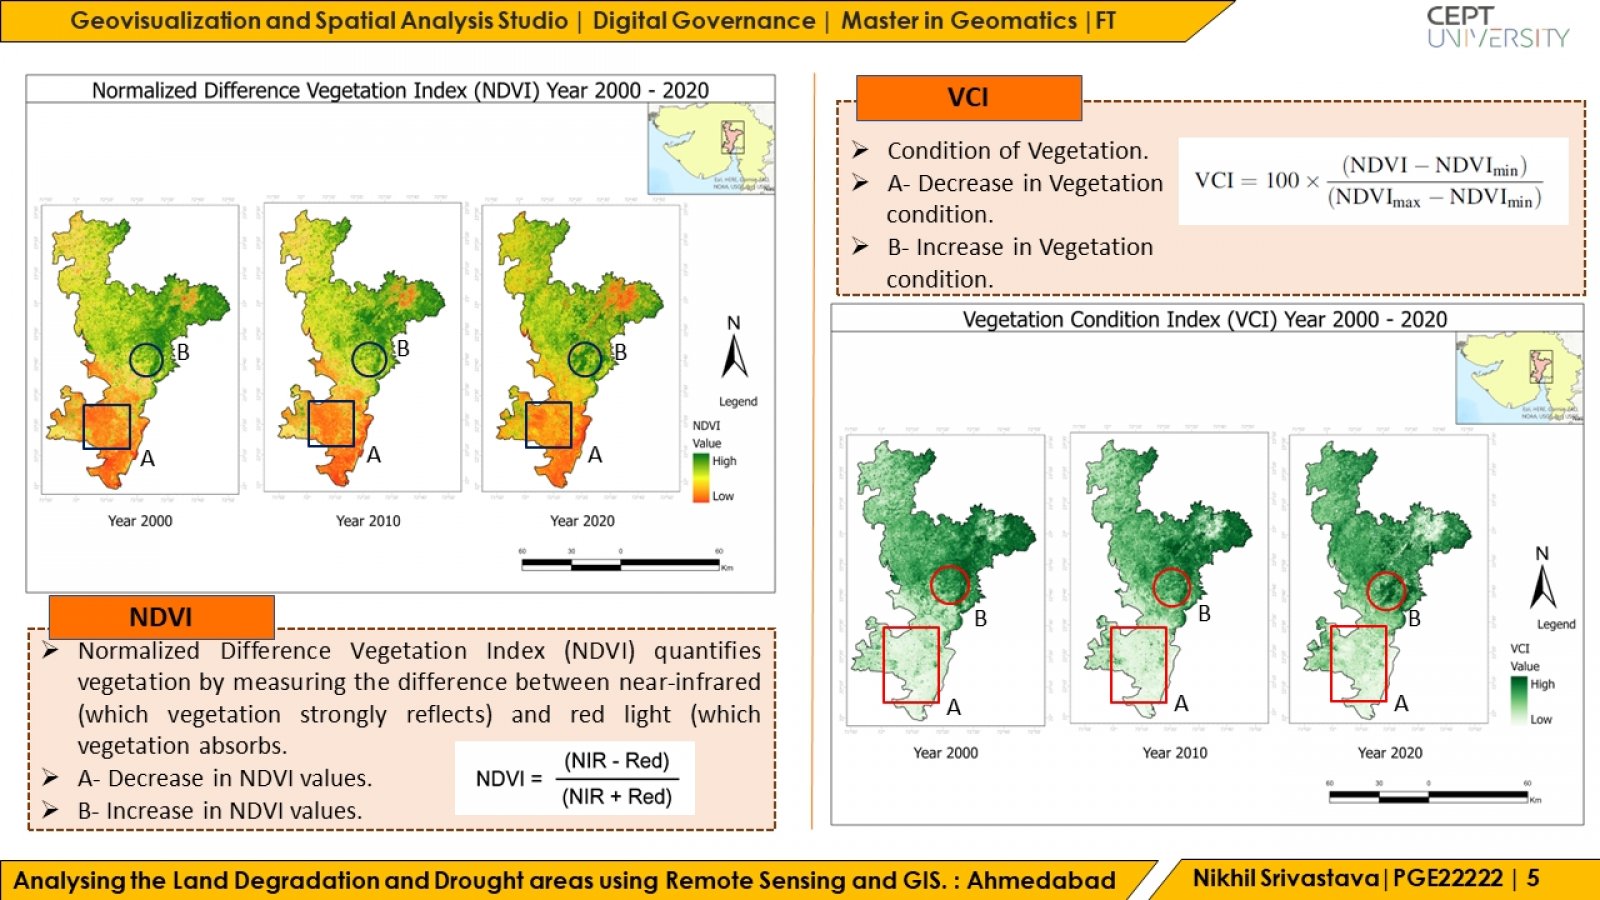
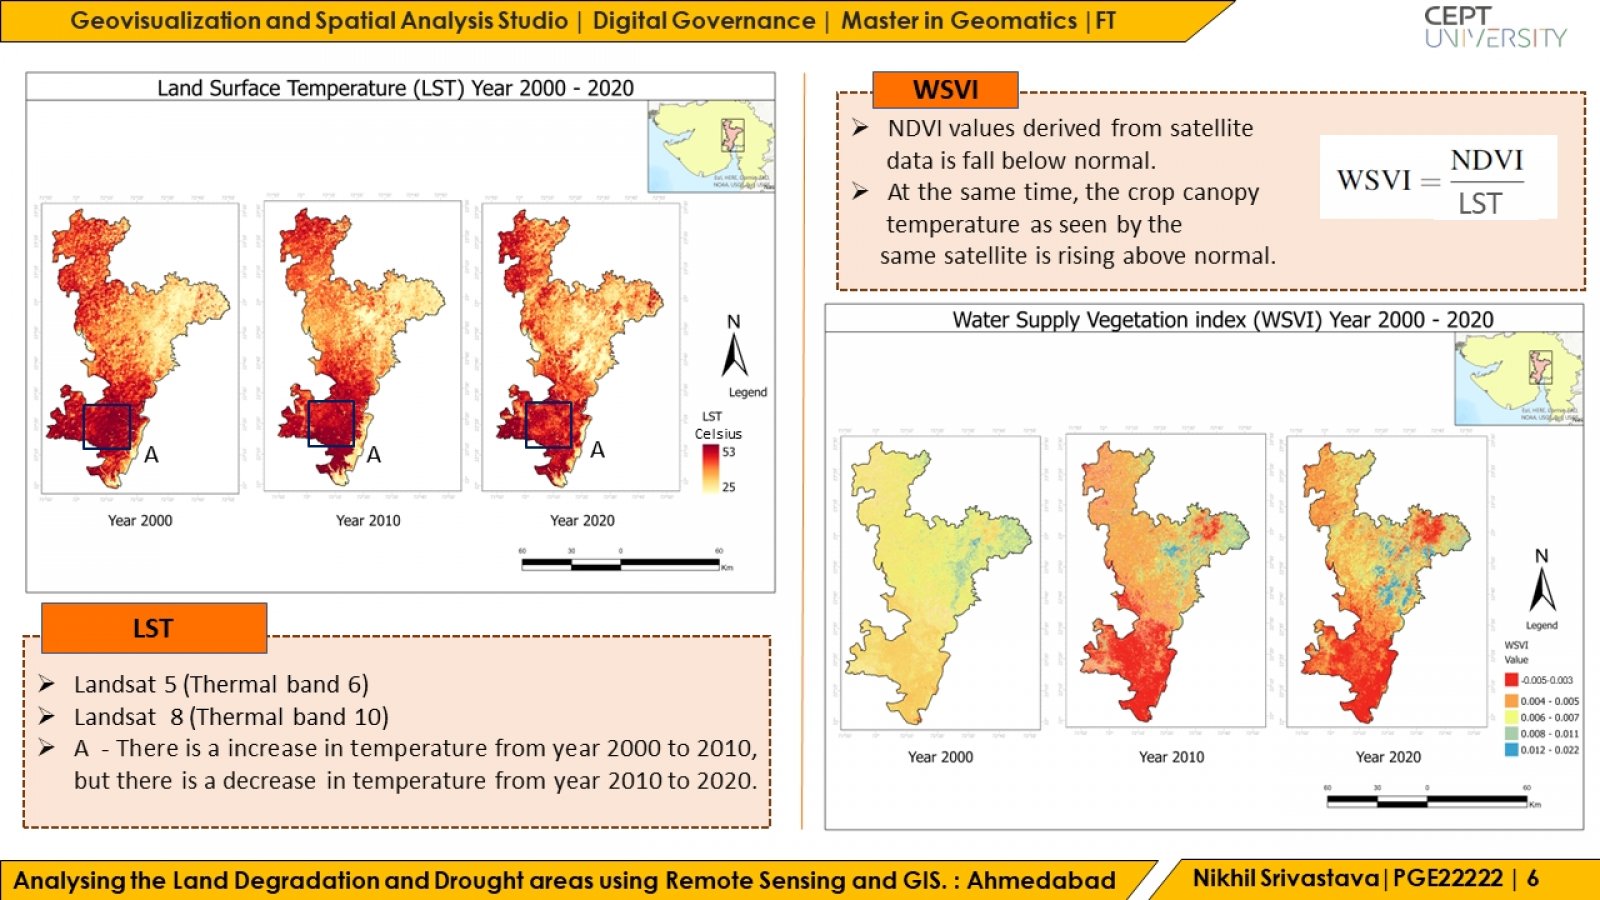
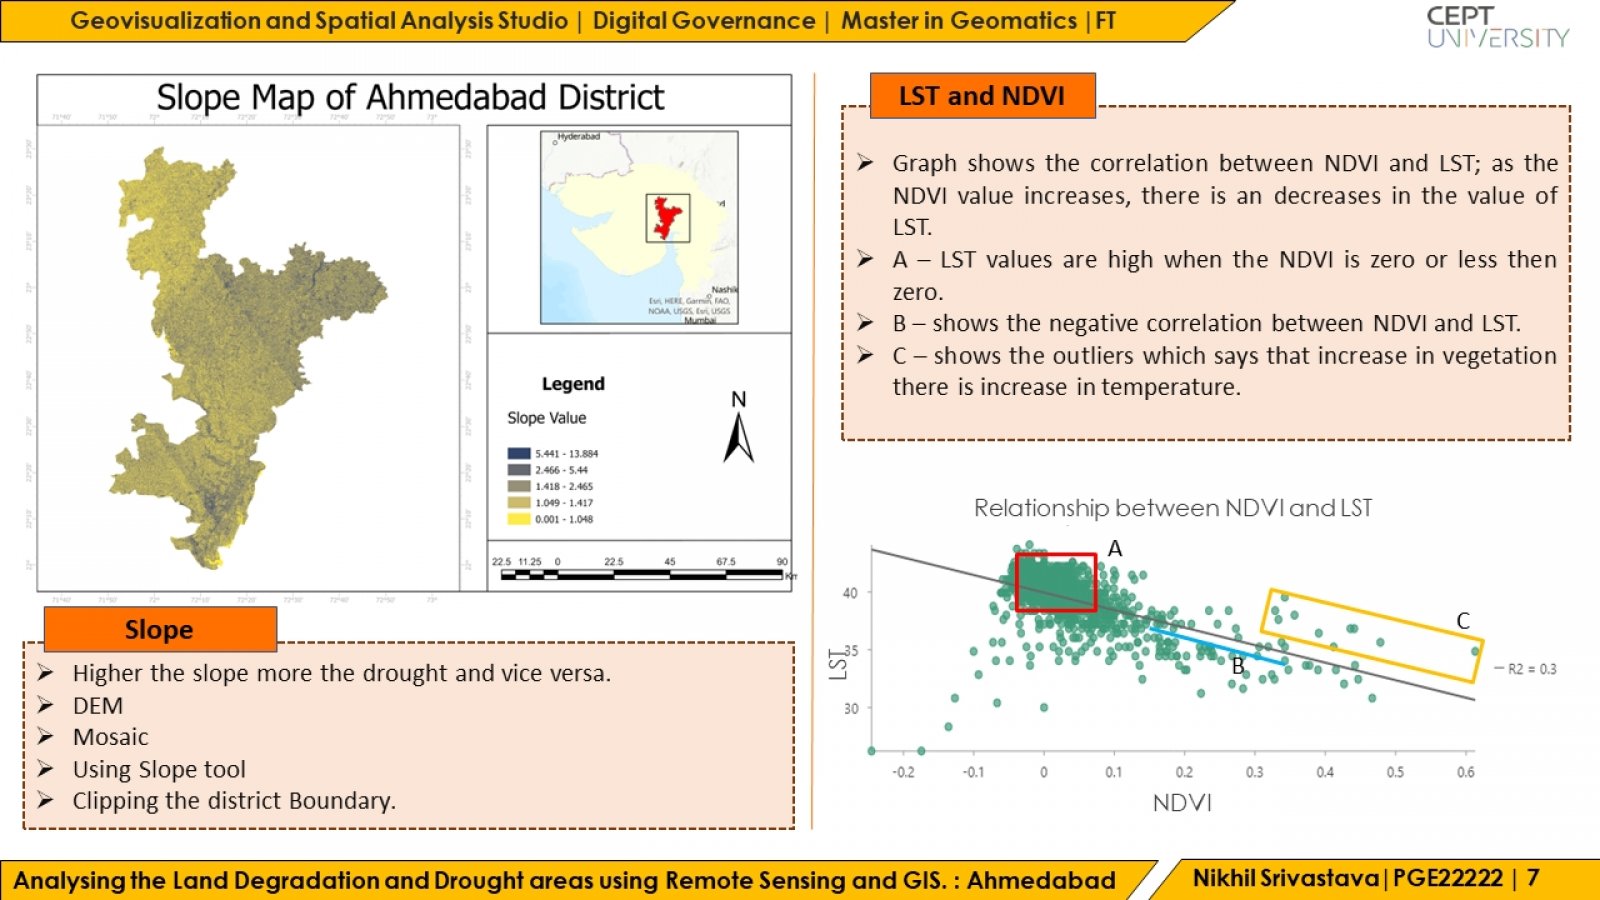
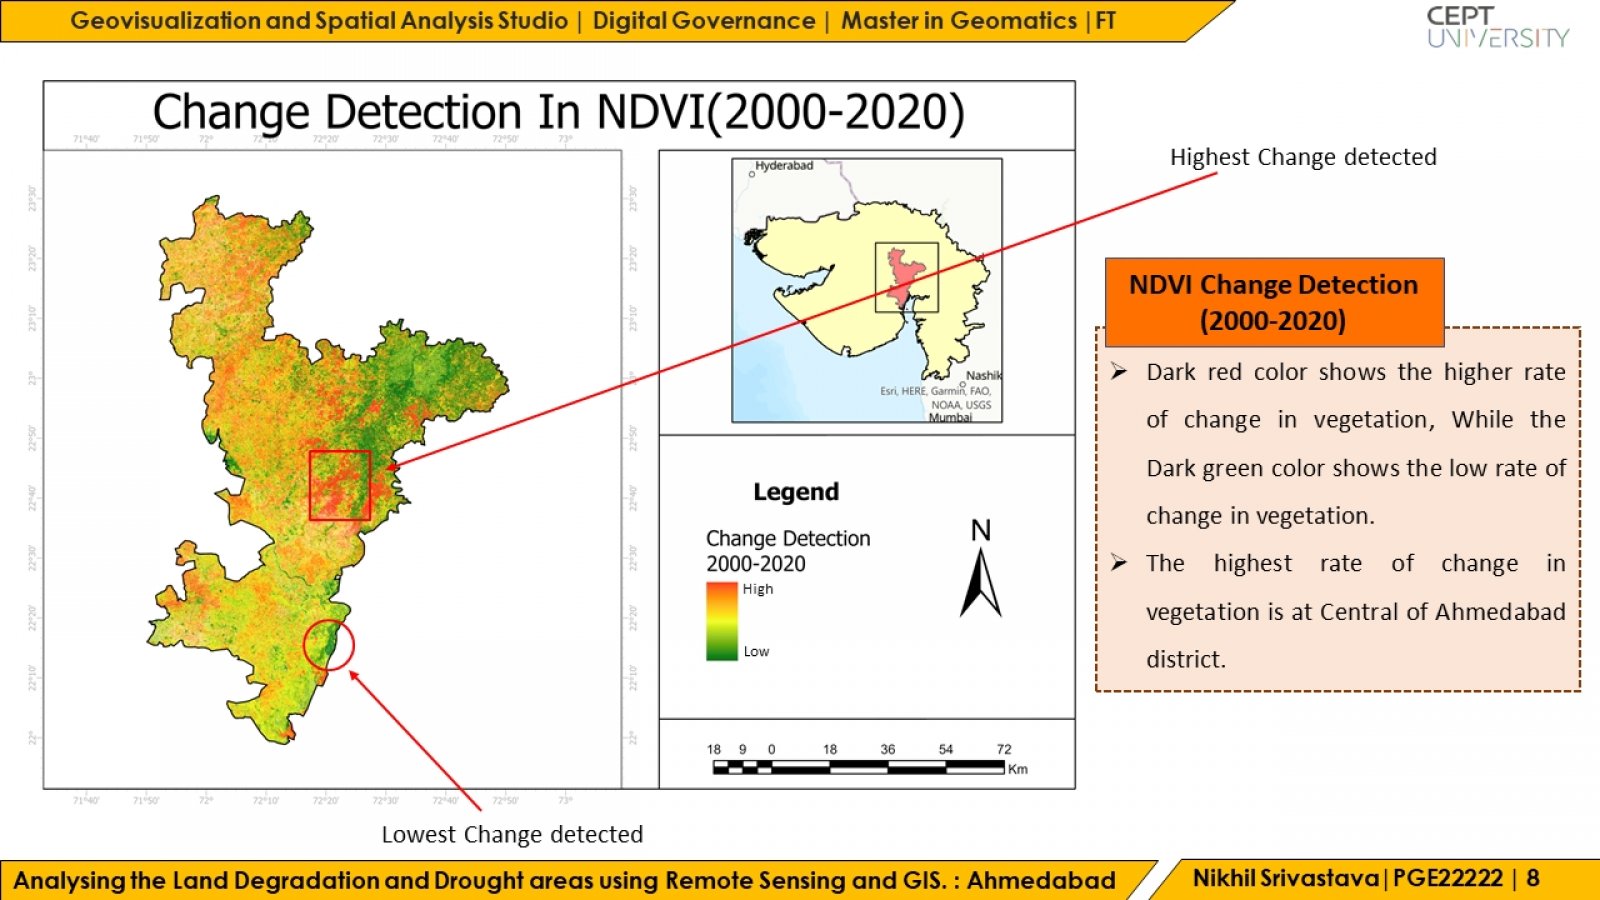
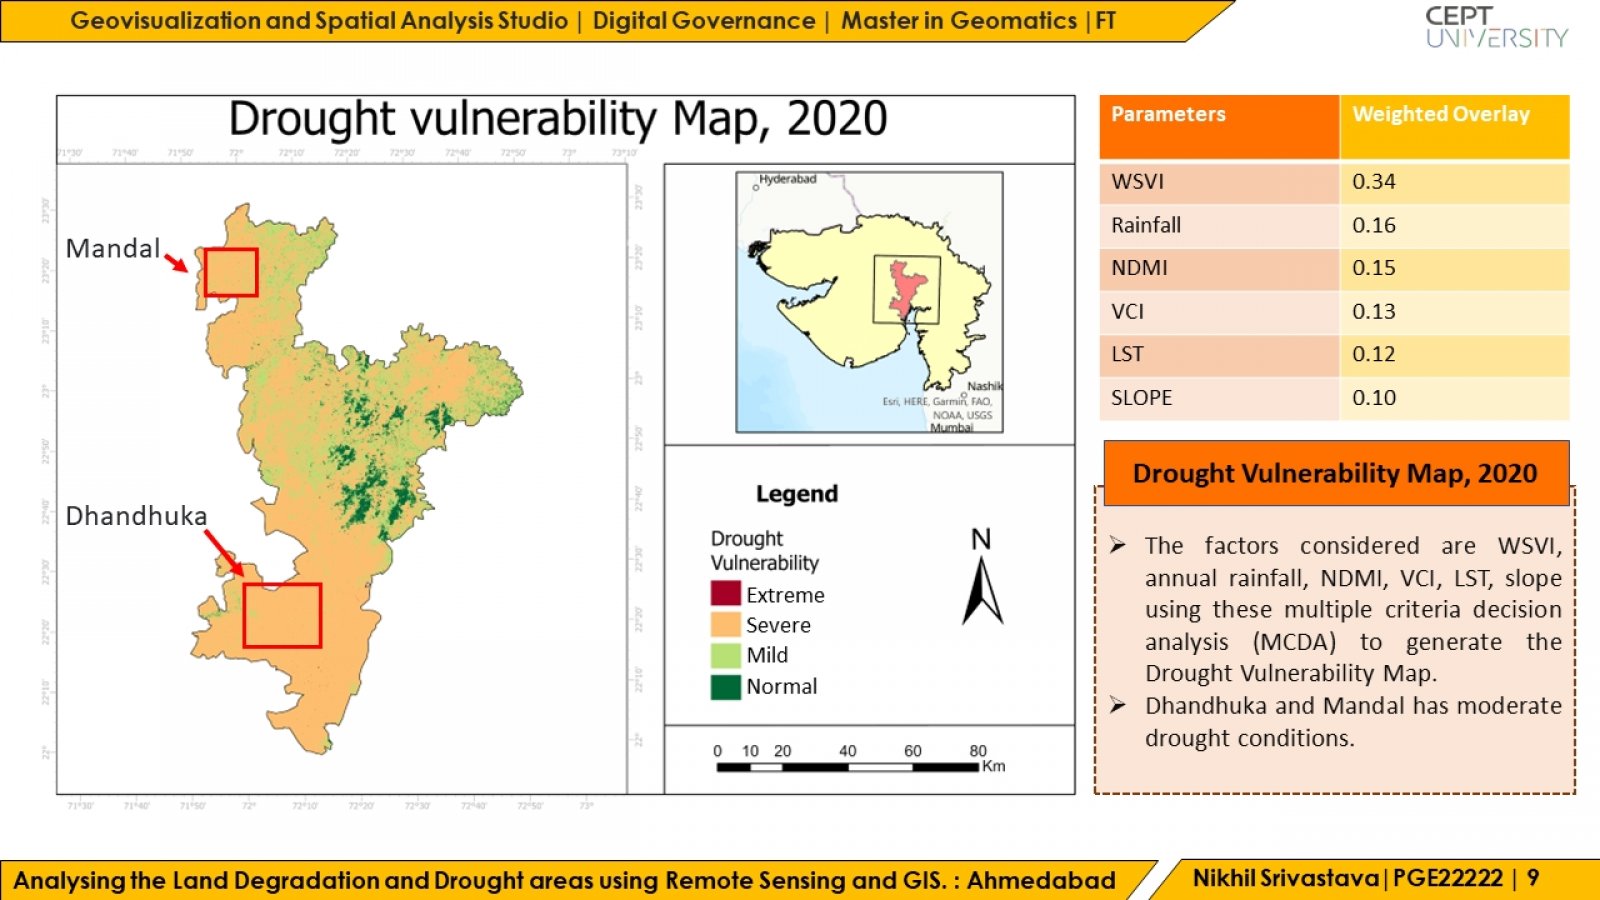
Ahmedabad district has an area of 8,086 km²; it has been observed that there has been a decrease in the annual rainfall over the past several decades, which is a significant factor in the cause of the drought areas. This study looks at the drought area in the Ahmedabad district using satellite images from 2000 to 2020. An annual rainfall map is generated to find the correlation with other indices. The NDVI index was calculated for vegetation cover. Computing NDVI, the Vegetation condition index (VCI) is calculated, giving an in-depth view of the condition of vegetation. The Land surface temperature(LST), using the Thermal band, shows the high-temperature areas. Using NDVI and LST, a significant drought indices Water supply vegetation index(WSVI) is calculated. The factors considered in this study are WSVI, annual rainfall, NDMI, VCI, LST, using these multiple criteria decision analysis (MCDA) to generate the Drought Vulnerability Map.